 If you were able to identify the USDJPY Short trade set-up and took the trade, that’s great. I took it, and, currently, I’m still in it. I’ll give analysis of today’s bias based on higher time frame charts, and then explain the steps I’ve taken so far in managing the Short trade.
On the Daily chart above, similar to what we observed on Wednesday, the USDJPY pair has been in a steep downtrend for more than a week. Previous days’ lows have been broken southward. Also, if we take a closer look at the Daily chart – precisely the previous two days’ candles – we would observe that the whole of yesterday’s price action occurred within Wednesday’s candle (price range), which resulted in an “inside-candle” formation. Price-break below the inside-candle earlier today signified the possibility of further movement of price downward. In addition, studying the narrow downward channel, price seems to have room to move further downward – toward the lower edge of the channel. These price actions are good signs supporting a bias for downward price movement.
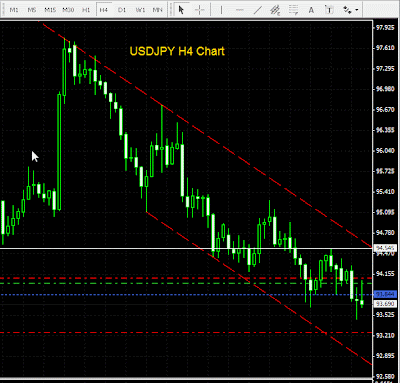
 On the H4 chart above, price broke the most recent swing low – also the previous day low @ 93.84 (which we’ve highlighted using the blue broken line) downward. That automatically sustained our bias in favor of a downward price move. The white horizontal line @ 94.54 highlights the most recent swing high, and as long as price stays below it – in the absence of any new and lower swing high – our bearish or downward bias remains intact.
 Pls NOTE: The H4 chart also gives us a clearer view of price action within the downward channel discussed on the Daily chart.
 On the Hourly chart above, price pattern was forming lower highs and lower lows; hence, I drew the Fibonacci tool using the most recent Hourly swing high @ 94.28, and the temporary price-bottom @ 93.46, and then identified an area around the fib. 61.8% ret. level as a potential price reversal area to place my Limit Order (Pls NOTE the 61.8% ret. level was supported by pivots, other fibs., and previous lows).
 Initial Stop Loss was placed 2pips above the most recent Hourly swing high @ 94.33 (broker’s spread included). Primary profit target @ 93.24 (two pips above the fib. 127% ext.).
 On The 15min chart above, after the Limit Order was triggered @ 94.01 (exactly on a Daily pivot level), price reversed downward almost immediately. Hence, I had a good opportunity to quickly turn the trade to a no-loss trade. With a 3-lot position, I took profit on one lot @ 19-pip profit, then, adjusted the Stop Loss for the remaining position to 9 pips above my Entry level, which was 5 pips above the most recent 15min swing high. That automatically made the trade a no-loss trade with a profit potential of 75 pips.
No comments:
Post a Comment